
本文微信小程序开发所使用技术:taro+vue+less
若使用 ec-canvas 加载图表时报错如下图:
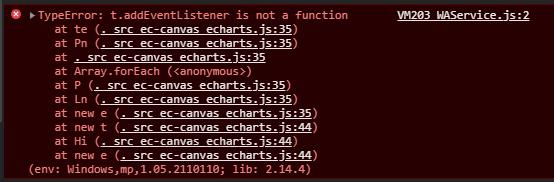
2. 创建要使用的图表组件,例如折线图(LineChart.vue,其他图表类似)。
<template>
  <view >
    <ec-canvas  id="mychart-dom-line" canvas-id="mychart-line" :ec="ec"></ec-canvas>
  </view>
</template>

<script>
import * as echarts from '../../../ec-canvas/echarts'
export default {
  name: 'LineChart',
  props: {
    lineData: {
      type: Array,
      default: () => {
        return []
      }
    },
    datePeriod: {
      type: Array,
      default: () => {
        return []
      }
    },
    legend: {
      type: String,
      default: ''
    }
  },
  data () {
    return {
      ec: {
        onInit: this.initChart
      }
    }
  },
  methods: {
    initChart(canvas, width, height, dpr) {
      console.log(echarts)
      const chart = echarts.init(canvas, null, {
        width: width,
        height: height,
        devicePixelRatio: dpr // new
      });
      canvas.setChart(chart);
      console.log(chart)
      var option = {
        tooltip: {
          trigger: 'axis',
          confine: true,
          formatter: function (params) {
            // console.log('params:', params)
            var text = params[0].name
            const len = params.length
            for (var i = 0; i < len; i++) {
              text += '年' + 'n' + params[i].marker + params[i].seriesName + ' ' + params[i].value + '万辆'
            }
            return text
          }
        },
        legend: {
          top: 5,
          right: 30,
          data: [{
            name: this.legend,
            textStyle: {
              color: '#383874'
            }
          }]
        },
        grid: {
          top: 36
        },
        color: ['#3B7FF0'],
        xAxis: { // 坐标系的 X 轴设置
          type: 'category', // 坐标轴类型,雷姆轴
          boundaryGap: false, // 坐标轴两边留白策略
          data: this.datePeriod, // X 轴类目数据
          nameTextStyle: {
            color: '#999999',
            fontSize: 20
          }
        },
        yAxis: { // 坐标系的 Y 轴设置
          type: 'value', // 数值轴,用于连续数据
          axisLabel: {
            formatter: '{value}'
          },
          nameTextStyle: {
            color: '#999999',
            fontSize: 20
          }
        },
        series: [
          {
            name: this.legend,
            type: 'line',
            // areaStyle: { // 渐变面积图
            //   color: {
            //     type: 'linear',
            //     x: 0,
            //     y: 0,
            //     x2: 0,
            //     y2: 1,
            //     colorStops: [{
            //         offset: 0, color: '#3A79EE' // 0% 处的颜色
            //     }, {
            //         offset: 1, color: '#3B7FF0' // 100% 处的颜色
            //     }],
            //     global: false // 缺省为 false
            //   }
            // },
            data: this.lineData
          }
        ]
      }
      chart.setOption(option)
      console.log(chart)
      return chart
    }
  }
}
</script>
<style>
.m-line-container {
  width: 100%;
  height: 100%;
}
.m-container {
  width: 100%;
  height: 100%;
}
</style>
3. 在要使用图表的 pages 页面配置中引入 ec-canvas。
export default {
  navigationBarTitleText: '折线图',
  usingComponents: {
    "ec-canvas": "../../ec-canvas/ec-canvas"
  }
}
4. 在要使用图表的页面引入图表组件。
<LineChart  legend="Tesla 产量" v-if="lineData.length" :datePeriod="dateDict" :lineData="lineData" />
import LineChart from './modules/LineChart'
export default {
  name: 'Index',
  components: {
    LineChart
  },
  data () {
    return {
      dateDict: [],
      lineData: []
    }
  }
}
5. 若 ec-canvas 下的 charts.js 文件过大。
可尝试通过在线定制 echarts.js 的方式解决: ECharts 在线构建
本文完!